
News
JETNET releases January 2011 market information
March 8, 2011, Utica, N.Y. - JETNET LLC has released January 2011 results for the pre-owned business jet, business turboprop, and helicopter markets.
March 8, 2011 By Carey Fredericks
Business Jet Delivery Cycles—2000 to 2010 View
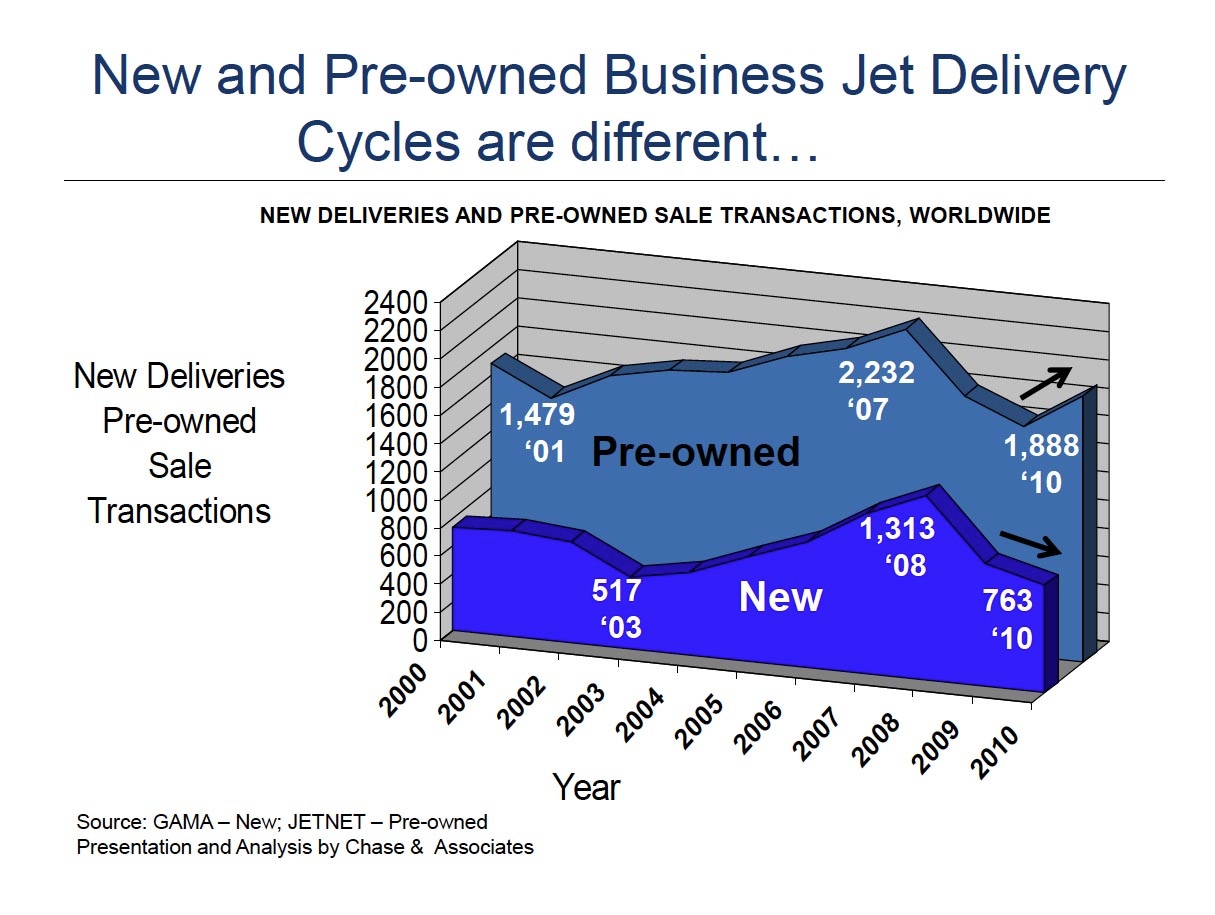
As illustrated in Chart A (below), the years from 2000 to 2010 reveal two different delivery cycles for new and preowned business jet market sectors. The pre-owned jet market had been on a steady increase from 1,479 sale transactions in 2001 to 2,232 in 2007 before starting a two year decline. New business jet deliveries lagged the pre-owned market decline by one year prior, having grown from 517 in 2003 to its record breaking year in 2008 with 1,313 deliveries, followed by two years of decline in 2009 and 2010.
The good news: after two years of decline in the pre-owned business jet market, 2010 has shown a reversal. The year’s 1,888 pre-owned business jet transactions was an increase of 16% over 2009, and 4.8% over 2008.
2010 new business jet deliveries of 763 were down by 12.3% compared to 870 in 2009. 2011 is expected to be another year of correction, but with a prediction of a strengthening of global economic conditions.
|
|
However, JETNET market analysts are expecting a strong rebound in 2012, primarily from the growth in
international economies.
Market Summary
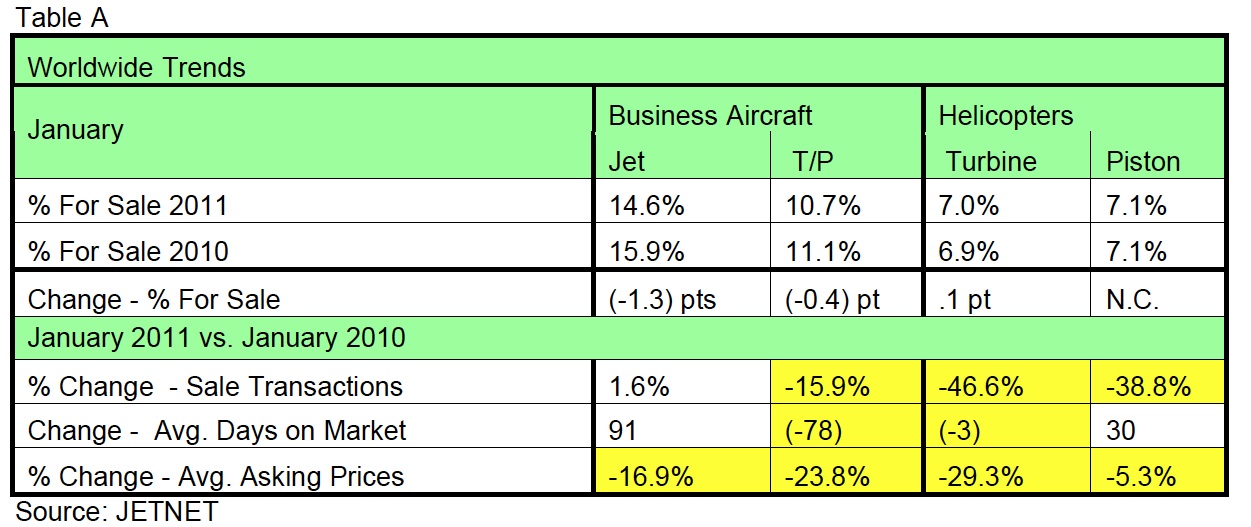
Highlighted in Table A (below) are the key worldwide trends across all aircraft market segments, comparing
January 2011 to January 2010. Business Jet inventory For Sale percentage showed the largest change (down 1.3 points), to 14.6% from 15.9%. For Sale percentages for both Turbine and Piston Helicopters sectors were unchanged in January 2011 compared to the same period in 2010.
Business Jet Sale Transactions increased 1.6% in January 2011 compared to January 2010. Business turboprop and helicopter categories all saw double digit declines in sale transactions in January 2011 vs. January 2010, a further softening of asking prices.
All pre-owned aircraft categories showed large decreases in average asking price percentages, ranging from a low of -5.3% for piston helicopters to -16.9% for business jets, -23.8% for business turboprops, and -29.3% for turbine helicopters (Table A, Worldwide Trends).
|
|
Pre-Owned Business Jet and Business Turboprop Aircraft For Sale
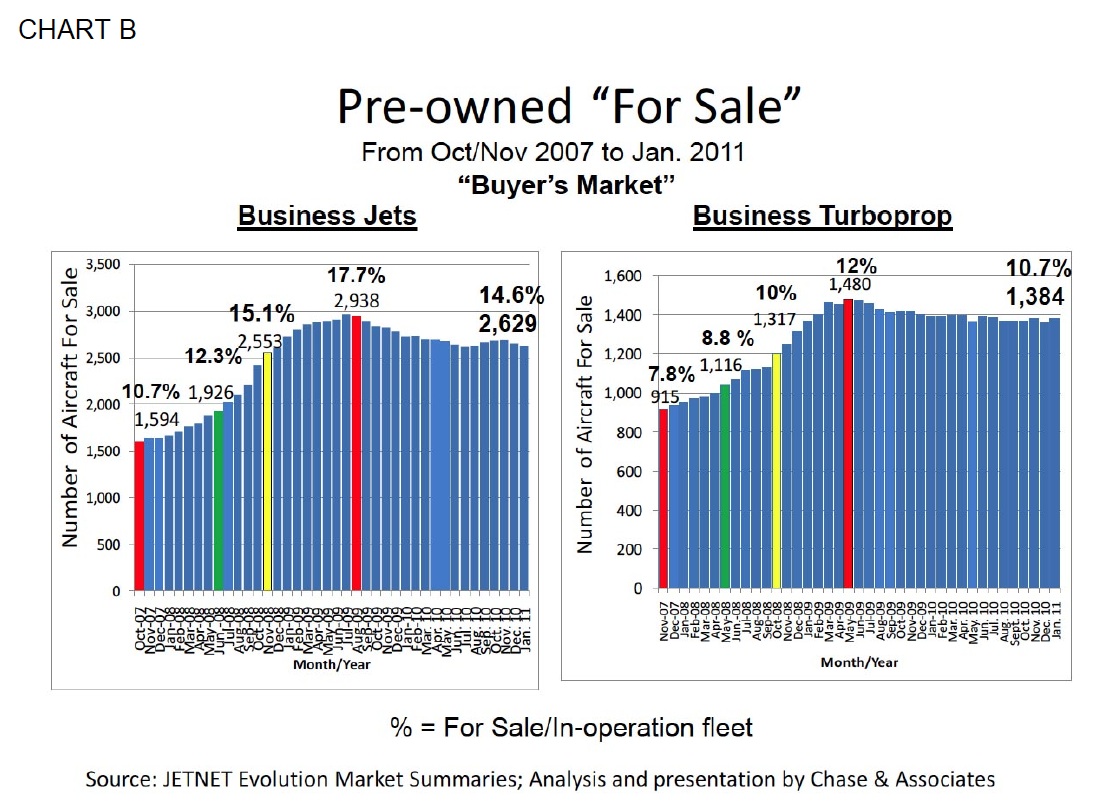
As illustrated in Chart B (below), the build-up in Business Jet For Sale inventory decreased slightly to 2,629 (or 14.6%) in January 2011 from 2,650 (14.8%) in December 2009. The same picture is true for the business turboprop market as well; it continues to hover just under the 1,400 For Sale inventory level. So we continue to witness stubbornly high levels of For Sale inventories as we remain in a buyer’s market, with business jets showing For Sale percentages greater than 10%. A seller’s market is when 10% or fewer of pre-owned business jets are for sale.
|
|
Pre-Owned Business Jets For Sale and Full Sale Transactions
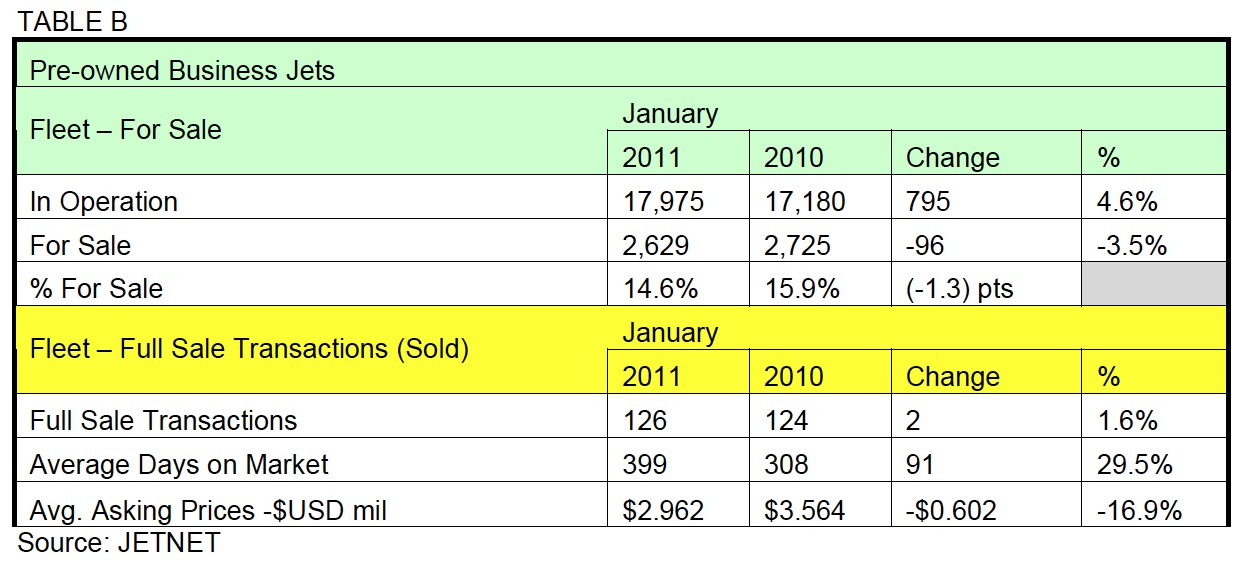
Table B (below) shows business jets results for January 2011 compared to January 2010. Inventory continues to decline, with Full Sale Transactions remaining about the same. The asking prices remain soft (down 16.9%) and the length of time on market of 399 days is about 3 months longer (91 more days) than in the comparable January period of 2010.
|
|
Pre-Owned Business Turboprops For Sale and Full Sale Transactions
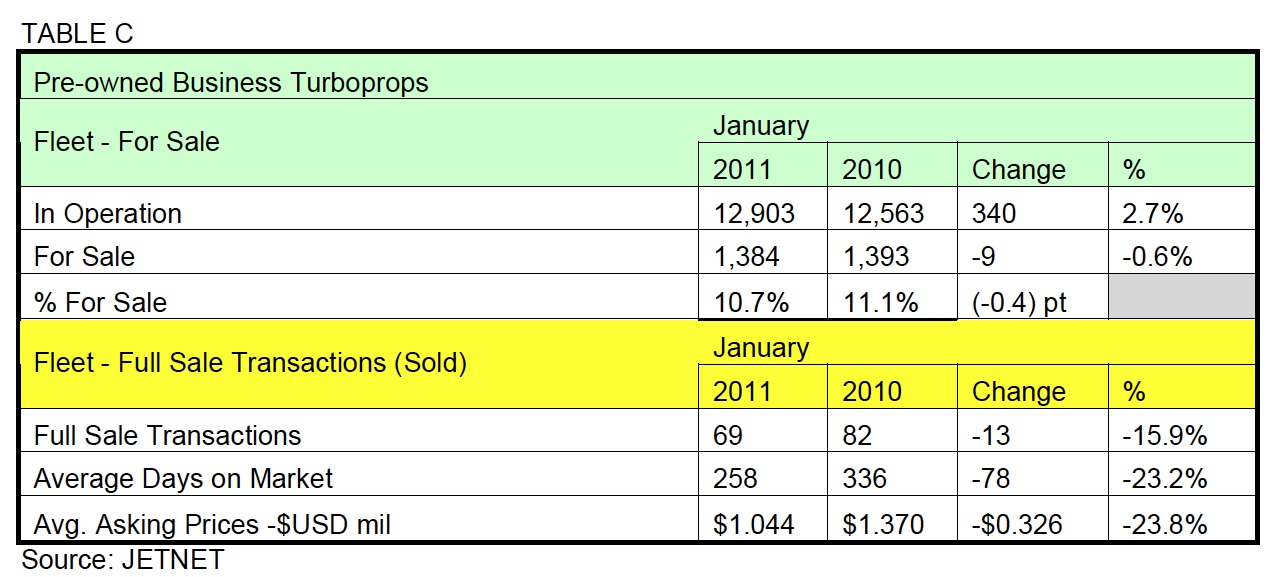
Table C (below) shows the business turboprop results for January 2011 compared to January 2010. Average
asking prices have declined by 23.8% to an average of $1.044 million. The Average Days on Market has been shortened by 78 days to 258 days. However, there have been fewer Full Sale Transactions (down 15.9%). A market correction is still a work in progress in the business turboprop market.
|
|
For Sale Inventory Turnover—Business Jets and Business Turboprops
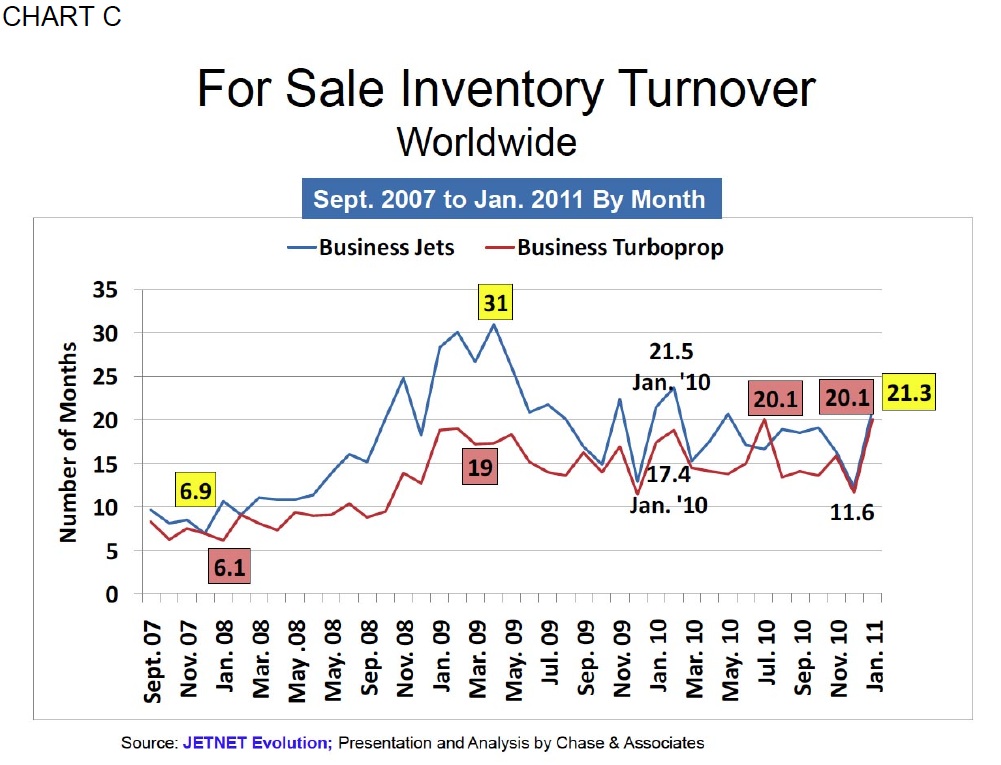
The For Sale Inventory Turnover rate is defined as the time (in months) it would take to sell off the number of aircraft listed for sale (For Sale inventory), based on the current Full Sale Transactions.
As illustrated in Chart C (below), the current inventory turnover for business jets is 21.3 months, compared to 21.5 months in January 2010. For business turboprops, the current inventory turnover of 20.1 months is up by 2.7 months compared to 17.4 months in January 2010, and equal to the peak set in July 2010.
|
|
Helicopter – Turbine (excludes Civil Russian manufactured helicopters)
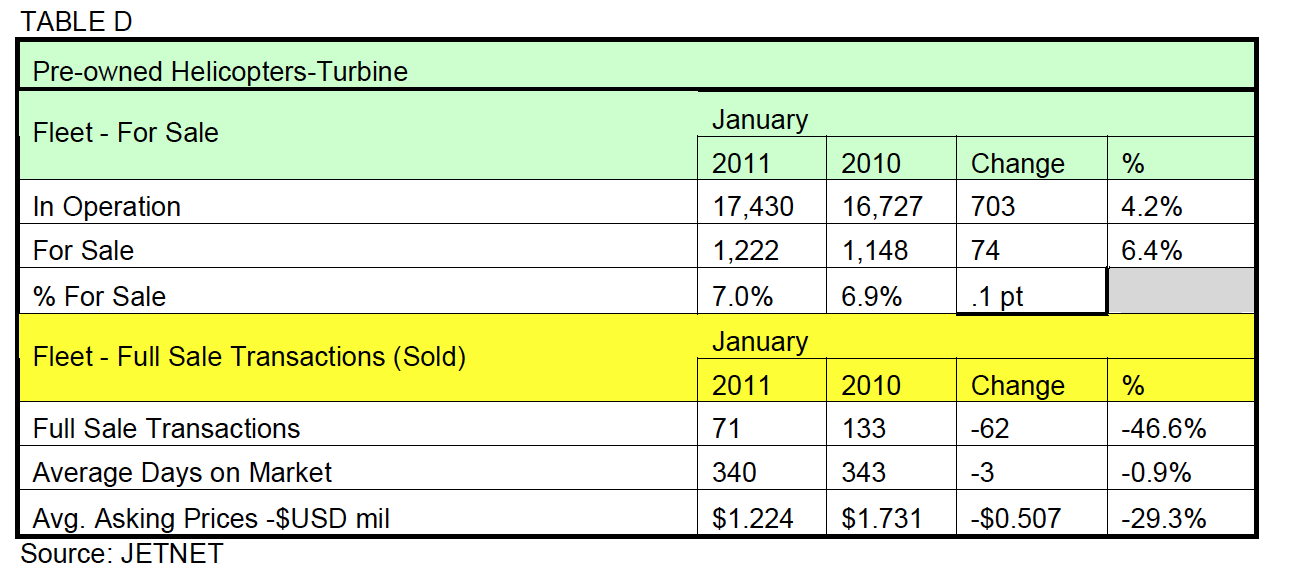
As shown in Table D (below) the percentage of pre-owned turbine helicopters for sale in January 2011 (7.0%, a buyer’s market) was only slightly up compared to 6.9% in 2009. A buyer’s market in the helicopter world is when the percentage of helicopters for sale exceeds 5% of the fleet.
|
|
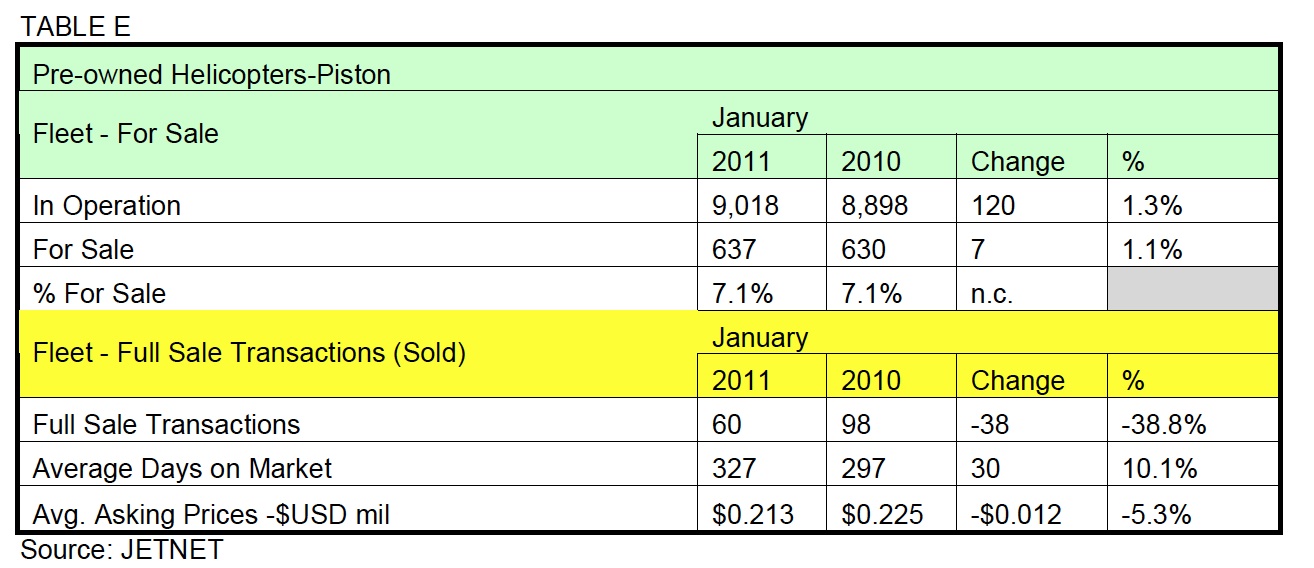
As seen in Table E (below), the number of pre-owned full sale turbine helicopter transactions declined by 46.6% in January 2011 compared to 2010. The Average Days on Market for turbine helicopters was 340, a number equal to 2010. However, the Average Asking Price fell by 29.3% in January 2011 compared to January 2010.
|
|
Helicopter – Piston (excludes Russian manufactured helicopters)
The number of Pre-owned Piston Helicopters For Sale in January 2011 was 637 helicopters, or nearly half the number of turbine helicopters. The Percentage For Sale of 7.1% in 2011 (a buyer’s market) was exactly the same as January 2010.
The number of Pre-owned Full Sale Transactions for piston helicopters decreased by 38.8% in January 2011
compared to January 2010. Average Days on Market for piston helicopters in 2011 was 327 days, 30 more days compared to 2010. However, Average Asking Price for piston helicopters fell by 5.3% in January 2011 compared to January 2010. The reality is that the current business down cycle will last longer than the industry would like. The good news is that the business aircraft and helicopter markets are on the right track.