
News
Year of correction continues in pre-owned markets
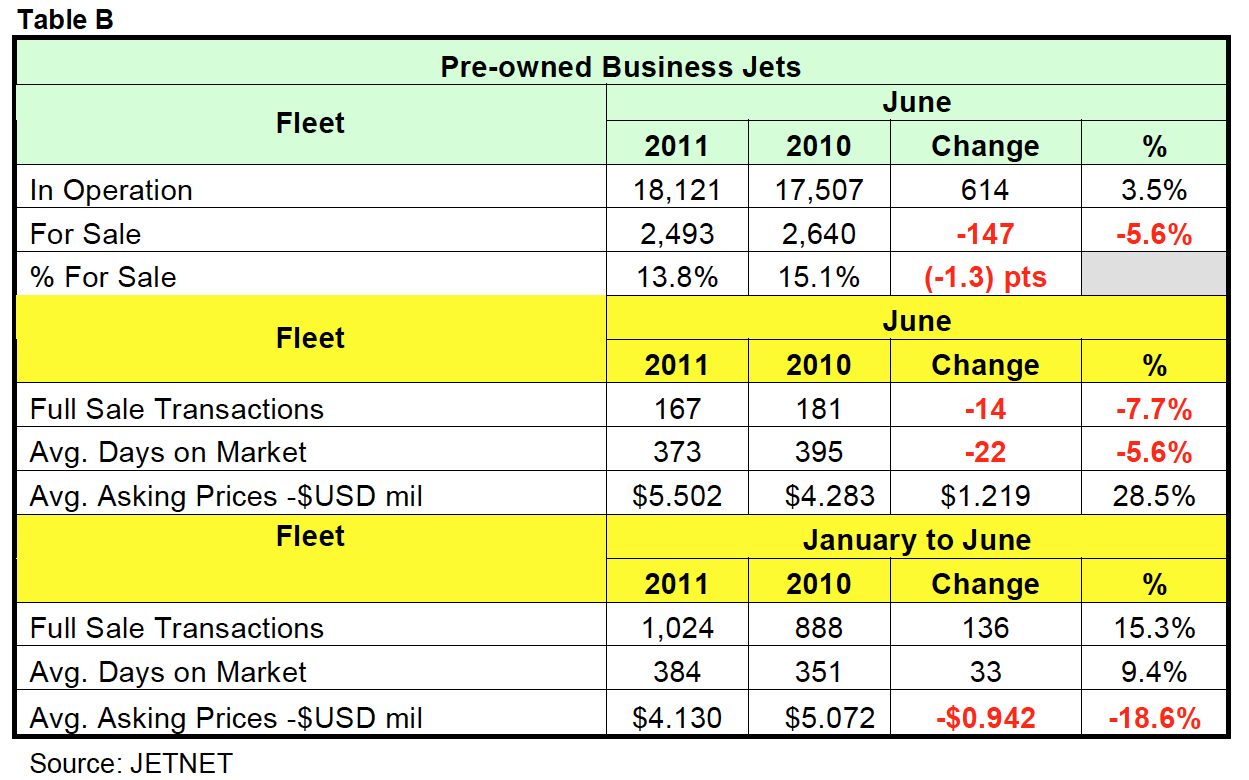
Aug. 2, 2011, Utica, N.Y. - JETNET LLC has released June 2011 and the first six months of 2011 results for the pre-owned business jet, business turboprop, and helicopter markets.
August 2, 2011 By Carey Fredericks
The health of the pre-owned market sets the stage for new aircraft orders, and we are all anxiously awaiting for more signs of improvement. After more than two years of decline, our expectations are that 2011 will be another year of correction with high hopes for sustained growth in 2012 and beyond.
JETNET reported that the first six months of the 2011 pre-owned market showed early-stage recovery signs. In June this trend continued as JETNET reported double-digit growth of 15.3% in pre-owned business jet retail sale transactions in the first six months of 2011, along with a continued decline in average asking price for the first half of 2011. However, compared to June 2010, the month of June improved by $1.2 million, or 28.5%, in average asking price for the first time in 2011. While one month of improvement in average asking price is not a trend, we are
hopeful that this key metric will continue to show improvement (Table B).
Market Summary
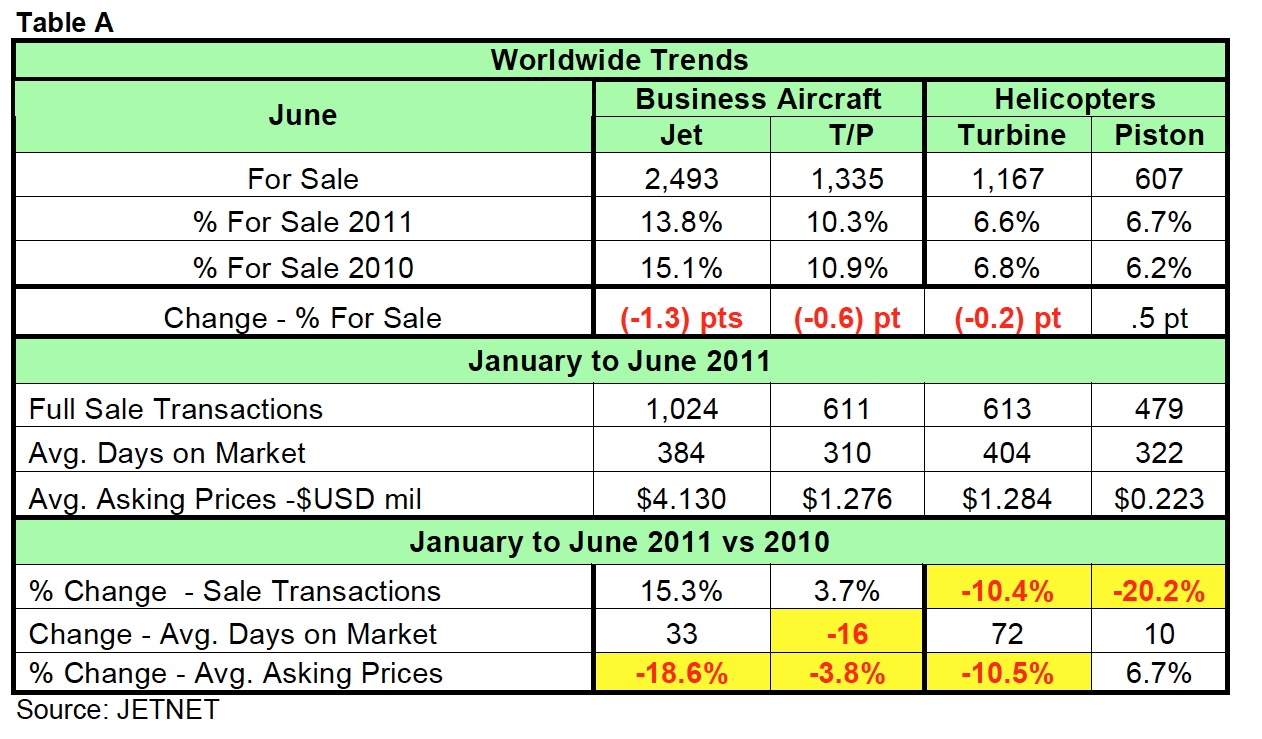
Highlighted in Table A are key worldwide trends across all aircraft market segments, comparing June 2011 to June 2010. Business Jet inventory For Sale percentage showed the largest change (down 1.3 points), to 13.8% from 15.1%. However, the only market sector to show an increase in for-sale inventory was the piston helicopter market, increasing 5/10 of a point, from 6.2% in June 2010 to 6.7% in June 2011. Business Jet Sale Transactions increased 15.3% in the first six months of 2011 compared to the same period in 2010. Business turboprops also showed an increase of 3.7%. Both helicopter categories saw double-digit declines in sale transactions (down 10.4% for turbine
and 20.2% for piston) in the first six months of 2011 versus the first six months of 2010.
All pre-owned aircraft categories showed large decreases in average asking price percentages except piston helicopters, with an increase of 6.7%. The decrease in average asking price ranged from -18.6% for business jets to -3.8% for business turboprops and -10.5% for turbine helicopters, as shown in Table A, Worldwide Trends.
|
|
|
|
View of the For Sale Inventory
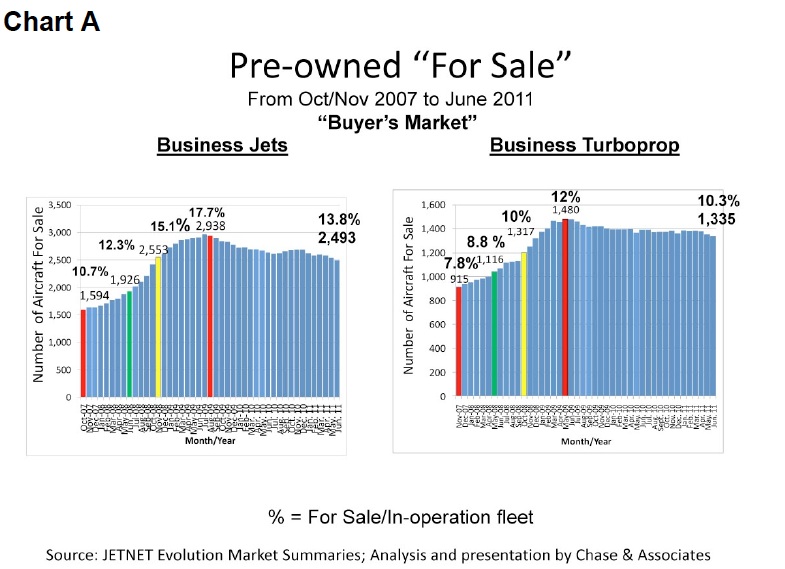
The For Sale inventory of business jets dropped below the 2,500 mark for the first time since November 2008, and the percentage dropped below 14% to 13.8% in June 2011. The business turboprop percentage For Sale ended at 10.3% in June 2011 as shown in Chart A. This is a positive sign, as the inventory for sale is dropping. Ever so slowly, but it is dropping.
|
|
As shown in Table C, more than 59% of business jets and more than 69% of business turboprops currently for sale are 16 years and older.

|
|
12 Month Moving Total Trends – Pre-owned Retail Sale Transactions
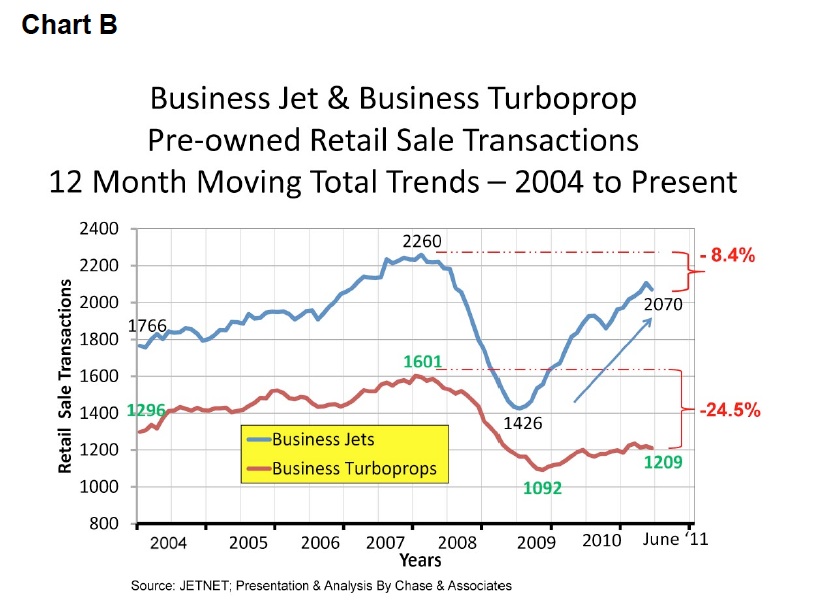
The 12 Month Moving Total Trend from January 2004 to June 2011, for both the Pre-owned Business Jet and Business Turboprop Aircraft Retail Sale Transactions, is illustrated in Chart B. As of June 2011, business jet retail transactions are 8.4% below the peak set in February 2008, and down 24.5% for business turboprops from the peak also set in February 2008. These are sharp rebounds from the 2009 lows and are good indicators that the correction process is in motion.
|
|
U.S. JET A Fuel Prices
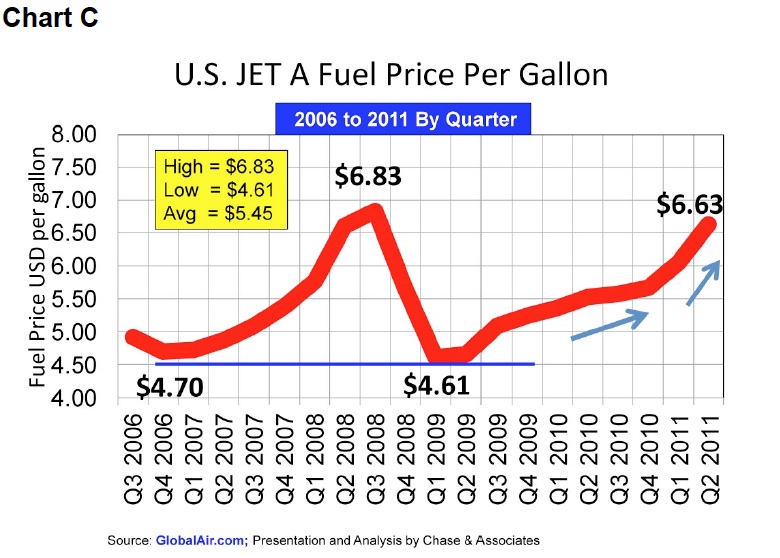
A few other “lowlights” we see so far this year are continued high fuel costs and a pre-owned turboprop retail transaction market that continues to be sluggish. Chart C shows that the 2nd quarter 2011 U.S. Jet A Fuel Prices at $6.63 per gallon are on the rise, up $1.27 per gallon from $5.36 in the 1st quarter of 2010. Current prices are only 20 cents, or 3%, below the 2008 fuel price bubble of $6.83 per gallon.
|
|
US Economy
The U.S. Bureau of Economic Analysis (BEA) reported that real gross domestic product—the output of goods and services produced by labor and property located in the United States—increased at an annual rate of 1.3 percent in the second quarter of 2011 (that is, from the first quarter to the second quarter), according to the "advance" estimate released by the BEA. In the first quarter, real GDP increased 0.4 percent. In the “third” estimate provided last month, the annual rate was 1.9% in the 1st quarter of 2011. Historically, whenever the U.S. economy shows a growth in GDP of greater than 3.0%, the business aviation market is in a growth mode. Unfortunately, the U.S. economy is now reporting GDP data in the first two quarters of 2011 at well below this level.
Summary
As we move into the new decade, optimism for our industry’s recovery is everywhere. The first six months of 2011 have shown us that pre-owned retail transactions are picking up nicely, and business jets are nearly at the 2007 peak levels. This positive pre-owned activity should be priming us to improved new OEM sales in the near future. However, the U.S. economy will require some growth stimulus that was wanting in the first half of 2011.
As the summer months fly by, we believe the second half of 2011 should continue on the path of correction, and we will once again prove that our business aviation industry is resilient and poised for a comeback.